No Drought (Preparing for it, so please conserve!)
Lovelady well height: 487. ft-msl (166.4 ft-Depth to Water)
Barton Springs: approximately 56 cfs 10-day average
The BSEACD drought outlook valid from May 10, 2018, to May 24, 2018 remains in “NO DROUGHT” as aquifer levels at the Lovelady well were helped out with a 3 inch rain event in early May that stabilized water levels to stay above Alarm Stage level and Barton Springs flow was also helped by the rains that boosted flow up to 66 cubic feet per second
Lovelady water levels are stable just after an early May shower of 3”. All area creeks saw a rise in stage and Onion creek went from dry to 4’ feet of stage in Buda with flow peaking at 28 cfs. Antioch cave valves were open and taking plenty of needed recharge. Onion creek has returned to dry as we have received only 1 inch since early May.
Barton Springs flow has also been on the rise since the rain, raising flow to a peak 66 cfs (up from 57 cfs just days before). The recent rain has postponed the BSEACD prediction of falling below Alarm Stage (below 38 cfs) from mid April to late June if we are not to get additional rain. This prediction seems to be staying on cource with such little rain.
A declaration of drought for the aquifers will be made by the District based on which of the two drought indicators enters drought condition first. Because of the 7 “ rain so far this spring, aquifer levels and Barton Springs flow have increased. This holds off drought for a bit longer and postpones the BSEACD prediction of drought conditions between April and June of this year to late June to early July. With The development of La Nina conditions, which is a tendency for hotter and drier conditions, may exacerbate the advance of drought.
Wednesday, May 30, 2018


Monday, April 23, 2018
Desalination and ASR Feasibility Assessment
No Drought
Lovelady well height: 487.6 ft-msl (165.7 ft-Depth to Water)
Barton Springs: approximately 62 cfs 10-day average
The Edwards Aquifer has been considered a vast source of inexpensive, high-quality drinking water for many years. However, restrictions have been placed on production from the Edwards in recent years, and rising demands have increased faster than the provision of other additional sources. With the past significant reliance on the Edwards Aquifer, other potential sources warrant further consideration. Potential sources within the boundaries of the BSEACD that are being minimally used, if at all, include the Middle and Lower Trinity aquifers, and the brackish portion of the Edwards. One prospective new water supply source is the large quantity of brackish groundwater in the eastern portion of the District. Texas Disposal Systems is located on this “donut hole” which is outside the jurisdiction of the BSEACD. Multi-port wells installed here have provided data necessary to analyze the feasibility of desalination of the brackish
groundwater; management of desalination treatment residuals; and using the treated water for aquifer storage and recovery (ASR).
Read more here
Lovelady well height: 487.6 ft-msl (165.7 ft-Depth to Water)
Barton Springs: approximately 62 cfs 10-day average
The Edwards Aquifer has been considered a vast source of inexpensive, high-quality drinking water for many years. However, restrictions have been placed on production from the Edwards in recent years, and rising demands have increased faster than the provision of other additional sources. With the past significant reliance on the Edwards Aquifer, other potential sources warrant further consideration. Potential sources within the boundaries of the BSEACD that are being minimally used, if at all, include the Middle and Lower Trinity aquifers, and the brackish portion of the Edwards. One prospective new water supply source is the large quantity of brackish groundwater in the eastern portion of the District. Texas Disposal Systems is located on this “donut hole” which is outside the jurisdiction of the BSEACD. Multi-port wells installed here have provided data necessary to analyze the feasibility of desalination of the brackish
groundwater; management of desalination treatment residuals; and using the treated water for aquifer storage and recovery (ASR).
Read more here
Tuesday, April 3, 2018
This year's Well Water Checkup will be on Wednesday, April
25, 2018 from 9am till 2pm. Screening is available to the first 50 well
owners in the District to come in, pre-register and pick up sampling supplies
and instructions. Sample supplies must be picked up by Tuesday, April
24. Come in to get supplies at the District office, 1124 Regal Row,
Austin, TX 78748.

The USEPA recommends that private water wells should be
tested annually for contaminants that can jeopardize the health of its users,
especially vulnerable populations like children, the elderly, or those with
compromised immune systems. Samples from private water wells will be
screened for common contaminants, including fecal coliform bacteria, nitrates,
and salinity.
You'll be able to bring in your water sample for analysis
on April 25 between 9am-2pm. Samples need to be less than 24 hours old
for best results. District staff will screen for salinity and nitrates
while you wait. Bacteria samples will be processed by an off-site
lab. Results will be mailed the following week. There will be an
after-hours drop-off available starting at 5:00pm on Tuesday, April 24.
Tuesday, January 23, 2018
Update on Current Dye-Trace Studies in the Upper Onion Creek Watershed, Hays County, Texas
No Drought
Lovelady well height: 497.8 ft-msl (155.6 ft-Depth to Water)
Barton Springs: approximately 54 cfs 10-day average
Read Here:
Tuesday, January 2, 2018
2017 Aquifer Status in Review
No Drought
Lovelady well height: 501.8 ft-msl (151.5 ft-Depth
to Water)
Barton Springs: approximately 61 cfs 10-day average
2017 began in a status
of No Drought following a trend which began back in 2014. In September ‘14,
water levels began to rise after above-average rainfall. Steady recharge
throughout 2015 and ‘16 continued to increase aquifer water levels as well as
Barton Springs flow. In January 2015, the Board updated the drought status from
Stage II Alarm Drought to No Drought. While measurements began to decline in
October 2016, and have steadily continued down, they remain above drought
warning levels. As of December 2017, we maintain a status of No Drought.
Austin has received 39" of rain which is just above our average rainfall (32" - 36") in 2017, which has produced little recharge and
resulted in aquifer water level decline. While levels are going down, the
benefits of previous wet years have provided a bolster against this drop at the
Lovelady Monitor Well, which has recorded data since 1949.
The rejuvenating effects
of above-average rainfall in 2015 and ‘16 (59” & 55” respectively) well-prepared
the region for a somewhat dryer 2017. La Niña conditions (see previous blog entry) in the Pacific are
likely to result in continued dry weather through the winter and beginning of
2018.
Happy New Year from BSEACD!!!

Tuesday, December 12, 2017
La Nina Climate Impacts and Outlook for Texas in 2018
In addition to November’s blog post on weak La Nina conditions developing in the tropical Pacific, below are some climate forecasts from the Climate Assessment for the Southwest (CLIMAS) team on La Nina’s potential impacts on Central and South Texas. As of early-November, the tropical Pacific and atmosphere were exhibiting weak La Nina conditions. Forecasts favor above-average temperatures and below-average precipitation through approximately February-April 2018.
Drought
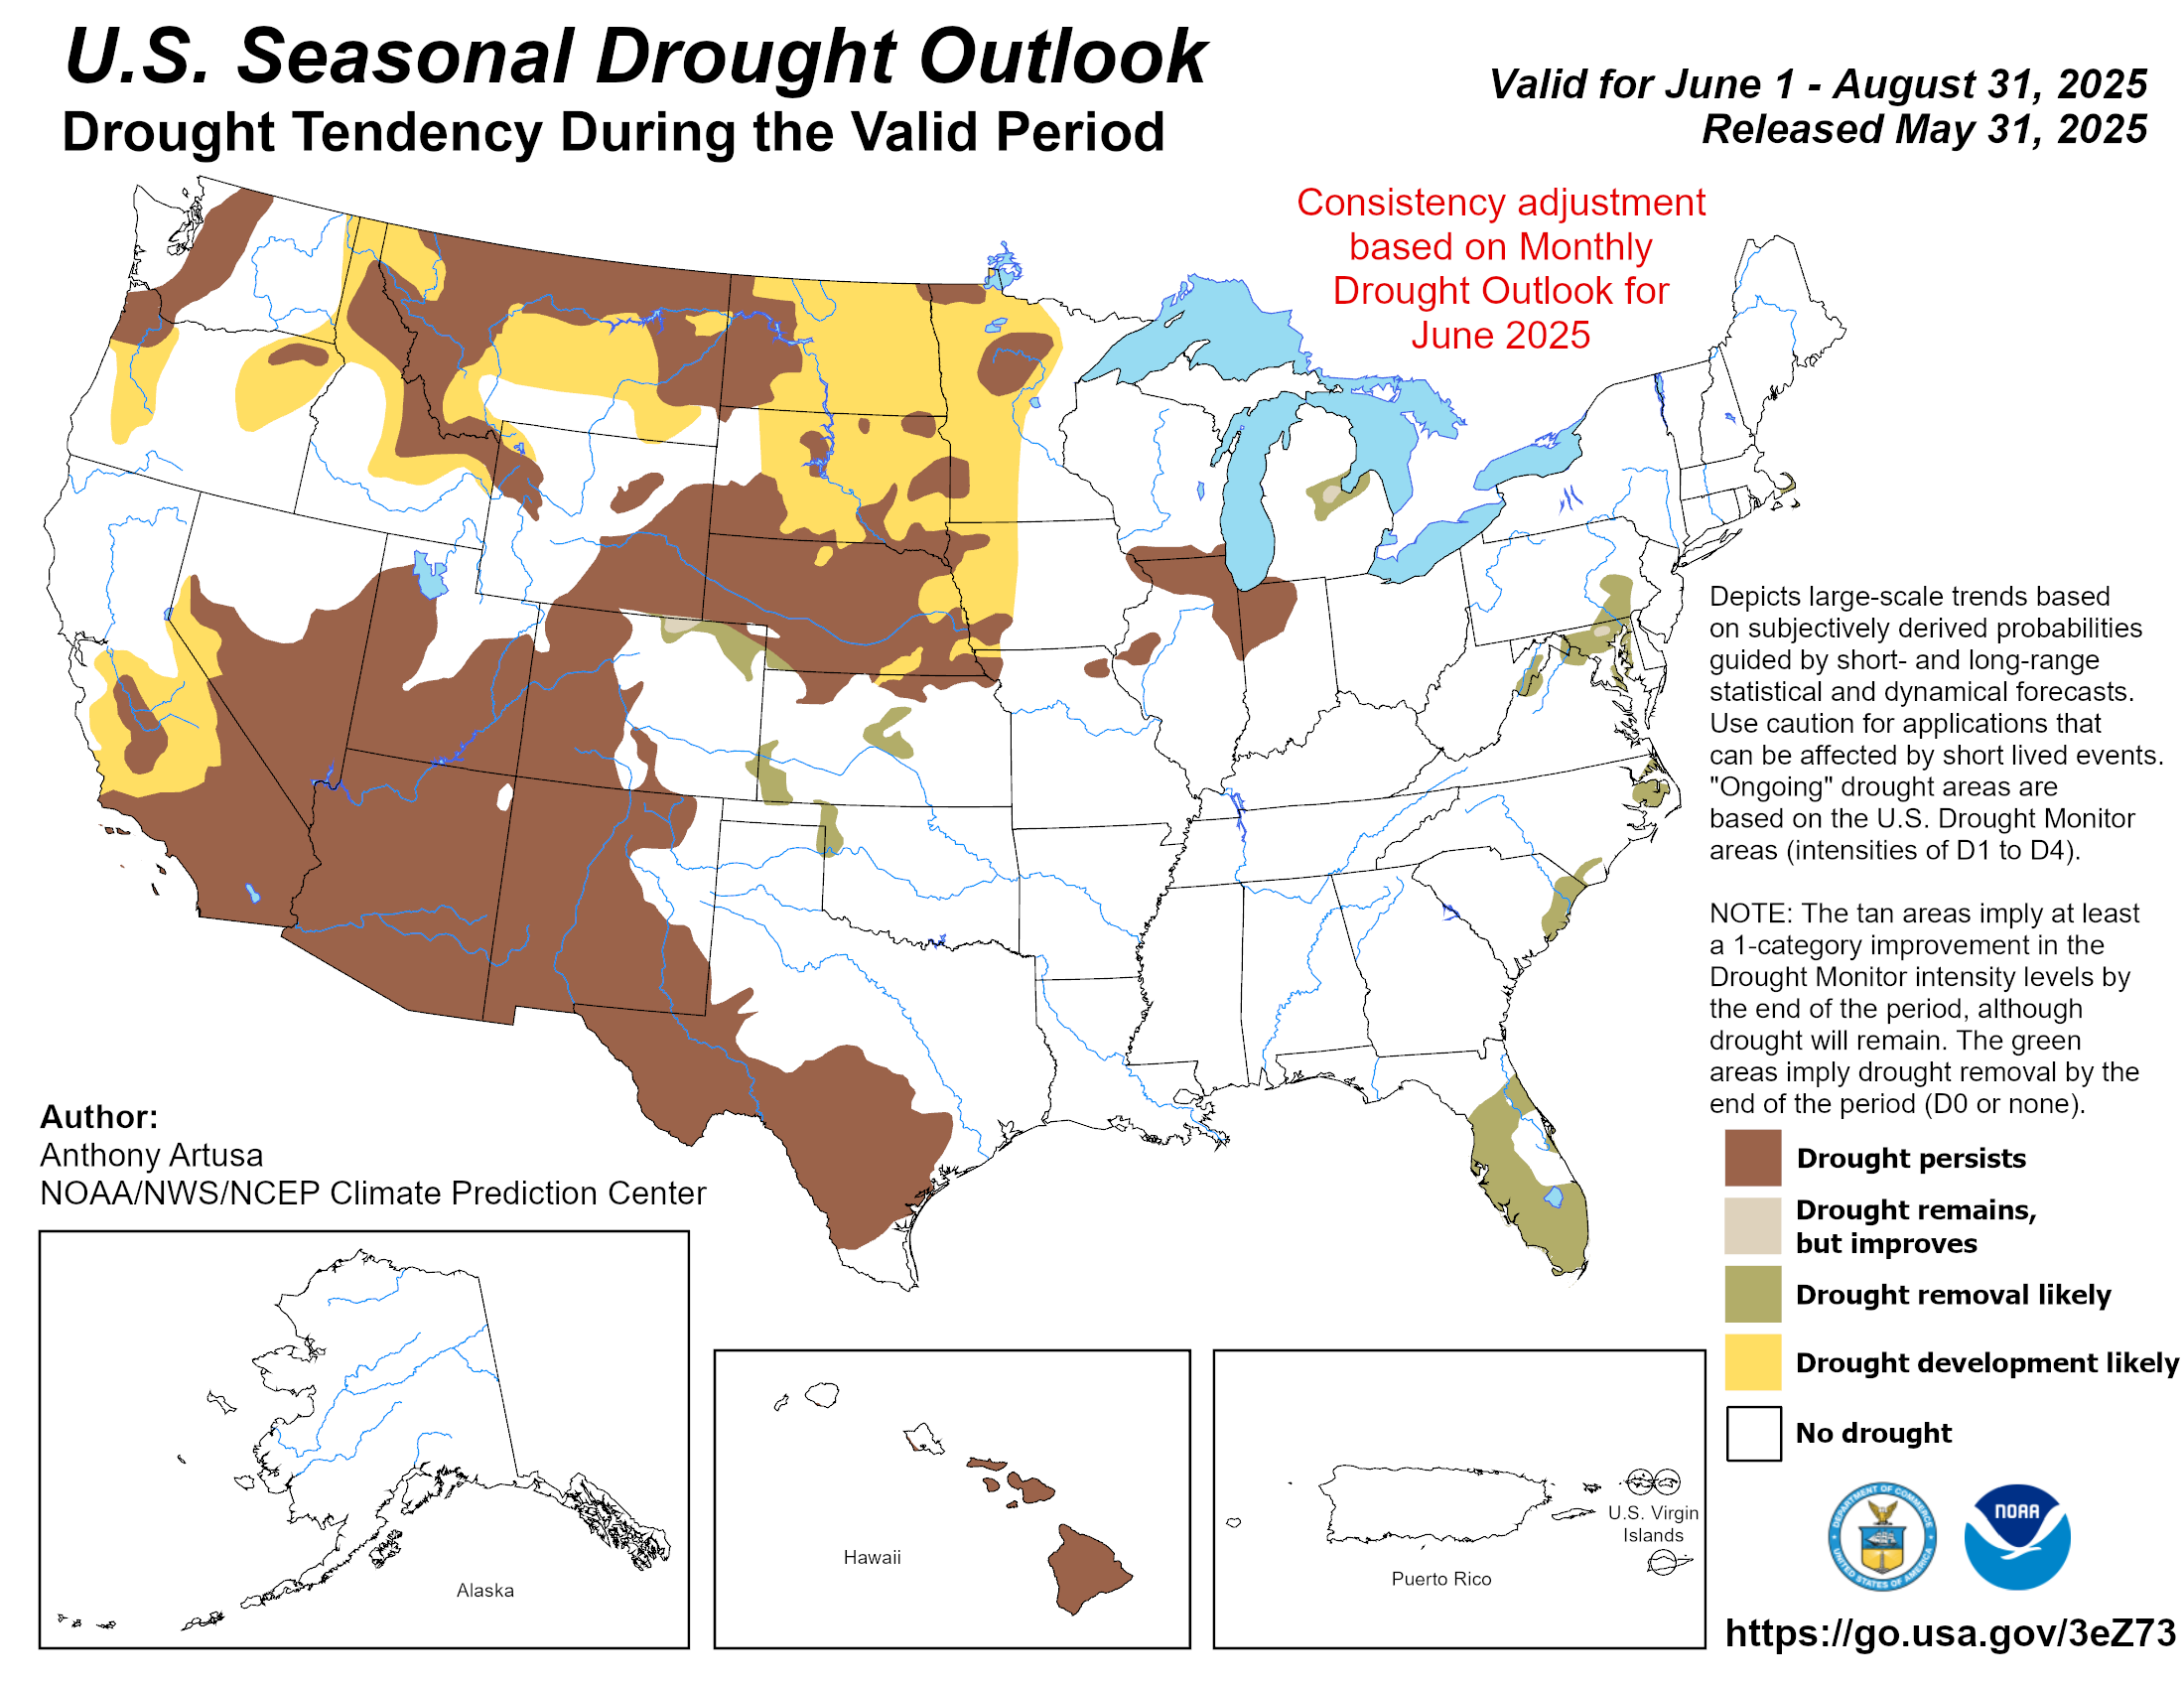
Abnormally dry conditions developed in areas of Central and western Texas between August and October while moderate drought conditions remained in southern Texas. Drought conditions in these areas are predicted to persist through February, according to the U.S. Seasonal Drought Outlook.
Temperature
The three-month NOAA temperature outlook (December-February)
favors chances for above-average temperatures for all of Texas through February.
favors chances for above-average temperatures for all of Texas through February.
Precipitation
The NOAA three-month precipitation outlook predicts chances for below-average
precipitation for all Texas, except for the northernmost point of the
state (December-February). La Niña conditions tend to lead to below-average
precipitation in the Southwest U.S. and northern Mexico.
precipitation for all Texas, except for the northernmost point of the
state (December-February). La Niña conditions tend to lead to below-average
precipitation in the Southwest U.S. and northern Mexico.
Fire
According to the National Interagency Fire Center (NIFC), fire risk is normal for
New Mexico and Texas through December (Figure 9).
However, La Niña conditions, projected to continue through the winter, are
predicted to bring dry and warm conditions to the Southern Plains, including
Central Texas, by January, making grasses and brush
more receptive to fire.
New Mexico and Texas through December (Figure 9).
However, La Niña conditions, projected to continue through the winter, are
predicted to bring dry and warm conditions to the Southern Plains, including
Central Texas, by January, making grasses and brush
more receptive to fire.
For More visit here
Monday, December 11, 2017
Texas Cities Using 21% Less Water (than we were in 2000!)
No Drought
Lovelady well height: 507.1 ft-msl (146.3 ft-Depth to Water)
Barton Springs: approxamately 62 cfs 10-day average

Wednesday, November 8, 2017
Move over El Nino, La Nina may be on the way
No Drought
Lovelady well height: 516.3 ft-msl (137.2 ft-Depth to Water)
Barton Springs: approxamately 75 cfs 10-day average
La Nina is the opposite of El Nino, a cooling of the equatorial east-central Pacific Ocean. If La Nina does develop, the strength of it (weak, moderate or strong) will determine what impacts it may have on the weather this fall and winter. Typically, the southern tier of the U.S. sees drier than average conditions and temperatures that are above average, while much of the Pacific Northwest and Ohio Valley are wetter than normal and see below average temperatures.(Weather Channel).

What does this mean for Central Texas?
As the La Nina effects suggest, "the latest outlooks for this fall and winter call for rainfall to average near to slightly below normal across our area. Along with that, temperatures should be a little bit milder than normal from October all the way through the end of winter." -Bob Rose, LCRA Chief Meteorologist
Monday, October 9, 2017
High and Dry: New Book Examines World's Biggest Groundwater Challenges
Through captivating stories and thoughtful prose, William and Rosemarie Alley take readers on a journey to better understand groundwater in their new book, “High and Dry: Meeting the World’s Growing Dependence on Groundwater.”


Read more here: https://www.newsdeeply.com/water/community/2017/03/21/high-and-dry-new-book-examines-worlds-biggest-groundwater-challenges
Tuesday, September 5, 2017
Hurricane Harvey and Central Texas
Hurricane Harvey and Central Texas
Hurricane Harvey made landfall on the Texas Gulf
Coast late Friday, bringing with it one of the most disastrous floods in the
state’s history. From Corpus Christi and Rockport to Houston and La Grange,
wind and rainfall from the storm caused damage and displacement on a
catastrophic scale. Houston alone received over 51” as of August 31st. That’s
the greatest amount ever recorded in the Lower 48 states from a single storm.
The effects of Harvey have extended to Central
Texas. Specifically, regarding rainfall:
- Buda saw 11.7” according to LCRA Hydromet
- Manchaca received 9.6” according to BSEACD gauges
- Driftwood recorded 7.4” according to LCRA Hydromet
- Austin (Mabry: 5.9”, ABIA: 6.2”) got roughly 6” (KXAN weather diary)
- Wimberley took 5.3” according to LCRA Hydromet
While rain was nearly constant in the region
beginning Friday evening and continuing into early Monday, the effects on the
stage level of local creeks and rivers might seem unexpectedly subtle. Although
all saw a rise in stage and flow, none achieved flood status as a result of the
downpour.
|
Creek/River
|
Top Stage Level Reached 8/27/17
(ft)
|
Historic (H)/Flood (F) Stage Level
(ft)
|
2015 Memorial Day Flood Stage Level
(ft)
|
|
Blanco River at
Wimberley
|
3.8
|
45
|
|
|
Onion Creek at
Driftwood
|
2.7
|
26
|
|
|
Onion Creek at Twin
Creeks Rd
|
12
|
32
|
|
|
Williamson Creek at
Manchaca Rd
|
7.2
|
12
|
|
|
Barton Creek above
Barton Springs
|
7.5
|
18
|
Springflow at Barton Springs saw a slight increase of five cubic feet per second (cfs) while Jacob’s Well Spring measured a 40 cfs increase.
Water levels in the Barton Springs Edwards Aquifer Conservation District (BSEACD) Lovelady monitor well were declining until the rain event brought stabilization.
Onion Creek at Driftwood saw a quick climb to
around 210 cfs late Sunday (8/27) night, though the peak was short-lived and
never reached flood stage status.

The LCRA reports rainfall totals near the
Highland Lakes ranged from less than an inch near Lake Buchanan to widespread
totals of 2-4 inches near Lake Travis. This was not enough rain to make a
significant difference in lake levels.
As Harvey drifted back toward the gulf late
Sunday, rainfall decreased and stage levels began to quickly decline. After the
deluge, the area received 9 inches in August, 7 inches above the average for
the month.
Subscribe to:
Posts (Atom)